Usage
Feature Overview
| Item | Content |
|---|---|
| Applicable Role | Model Provider and Model Consumer |
| Navigation Path | AI Infra(On-Prem) > Quotas & Usage > Usage |
| Page Route | /powerone/quota-usage/usage |
| Managed Object | Configuration, status, and relationships on Usage |
Beginner Explanation
My usage is like a personal resource consumption record, used to view how much compute, storage, and service resources were used over a period of time.
Terms
| Term | Description |
|---|---|
| Quota | Resource upper limit available to a tenant. Common dimensions include GPU, CPU, memory, and specifications. |
| Specification | Resource package that a job can request, such as CPU, memory, GPU model, and card count. |
| Consumption Details | Specific resource consumption records under a specification. |
Recommended Operation Order
Confirm prerequisites for Resource specification usage, quota occupation, and consumption details, follow Main Operations, run Result Validation, and continue to the next page.
First-Time User Notes
Confirm that the task involves Configuration, status, and relationships on Usage, and then follow the recommended order. If fields or state differ from expectations, check prerequisites before continuing downstream.
Prerequisites
- The current account has permission to view resource usage.
- The platform already has quota or usage statistics.
- To locate specific instances, permission to view the corresponding instances is required.
Page Description
Use this page to review resource-specification usage, quota occupancy, and consumption details.
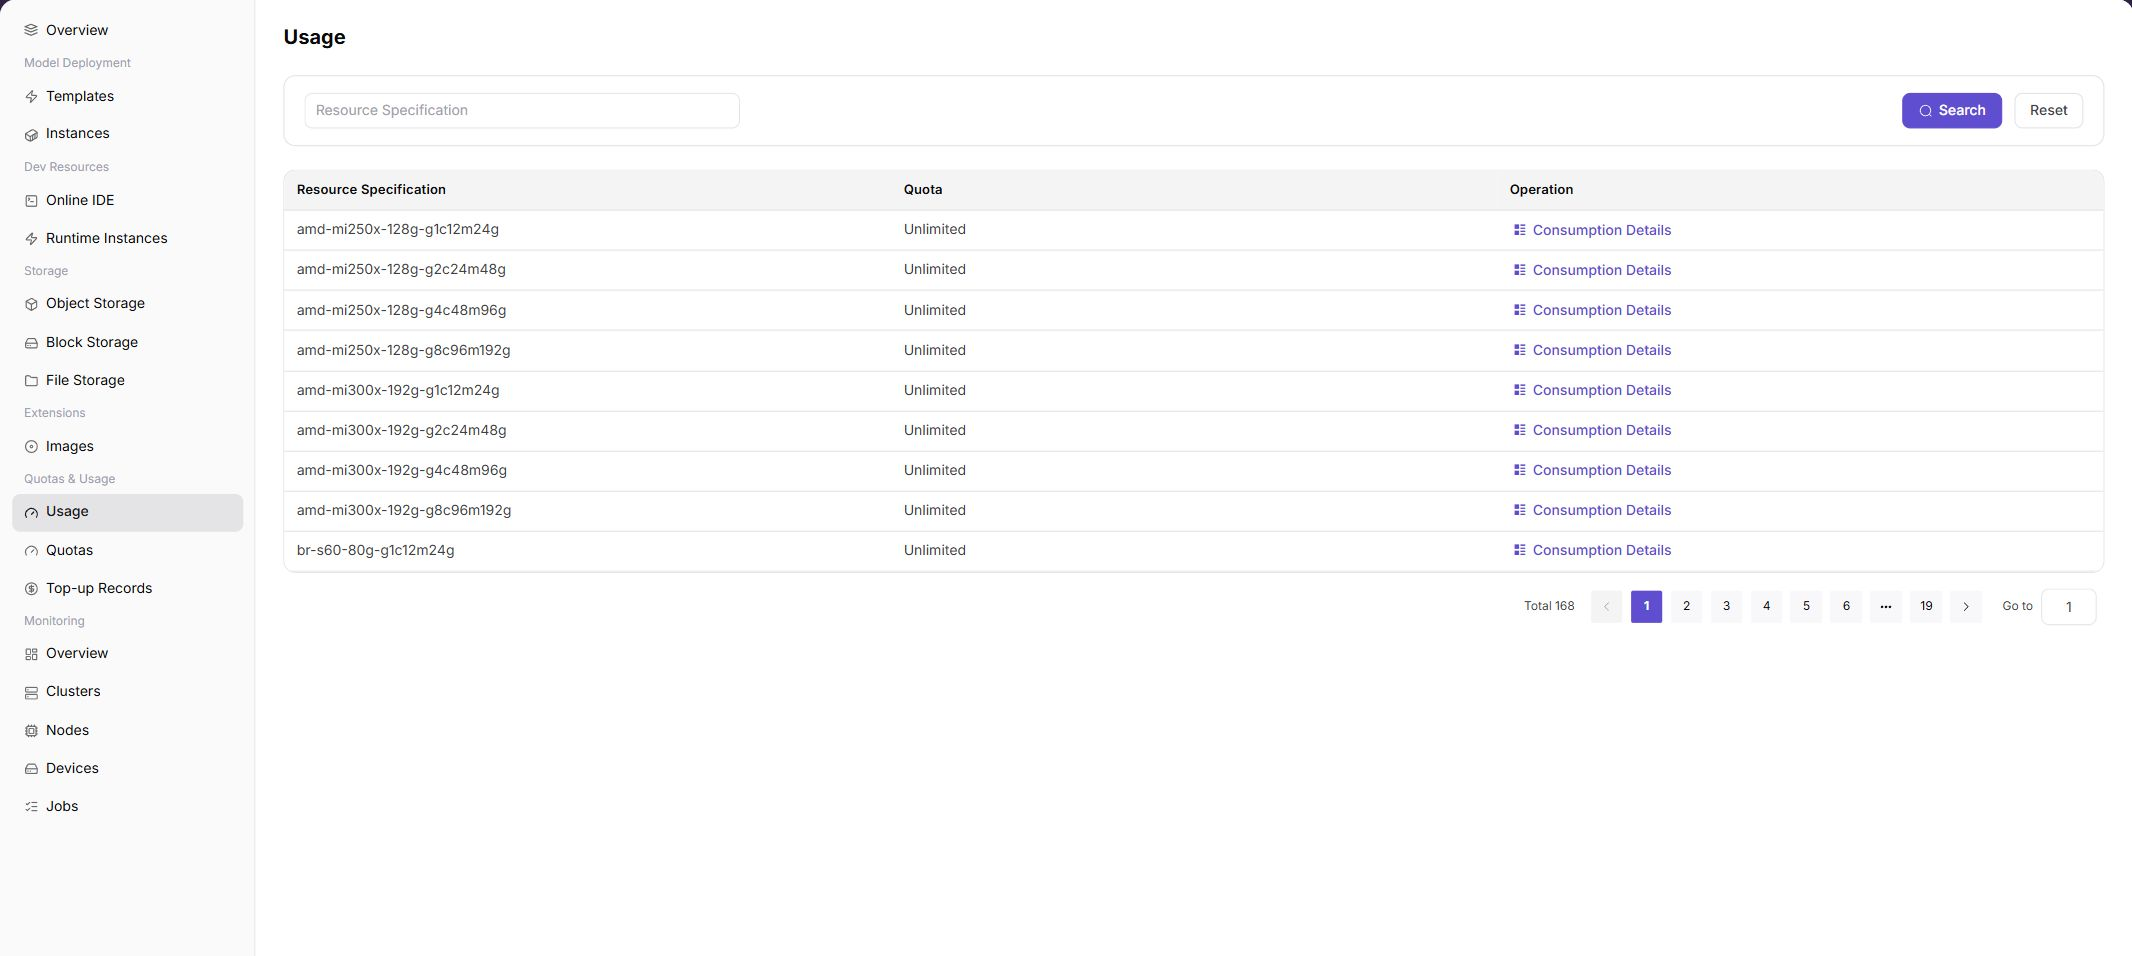
The page displays resource specifications, quotas, and operation entrypoints in a table. The screenshot shows multiple specifications with Unlimited credits and provides Consumption Details.
Page Areas
| Field/Area | Description |
|---|---|
| Search Area | Filters resource specifications by conditions. |
| Resource Specification | Specification name. |
| Quota | Quota limit for this specification. |
| Consumption Details | Opens consumption details for this specification. |
| Pagination Area | View by page when there are many usage records. |
Main Operations
View Resource Usage
- Go to
Quotas and Usage > Resource Usage. - Select a time range and filter by project, region, resource type, or instance.
- Check usage, unit, consumption direction, and refresh time.
- If no record is returned, check the time zone and reset filters. Redact usage and project data before sharing.
Investigate Abnormal Consumption Details
- Click an abnormal total or target detail while keeping the same time range.
- Compare instance lifecycle, metering details, and top-up records.
- Determine whether the anomaly results from continuous runtime, flavor changes, delayed metering, or quota adjustment.
- Do not start or stop real resources to test consumption anomalies.
View Consumption Details
Applicable Scenario
When you need to confirm which instances or tasks caused resource consumption for a specification, view consumption details.
Pre-Operation Check
- The target resource specification has been located.
- Filters are confirmed not to exclude target records.
Procedure
- Go to
AI Infrastructure > On-Prem > Quota & Usage > Resource Usage. - Find the target specification.
- Click "Consumption Details" in that row.
- View consumption records in the details dialog or drawer.
- Continue troubleshooting by instance name, time, and resource type.
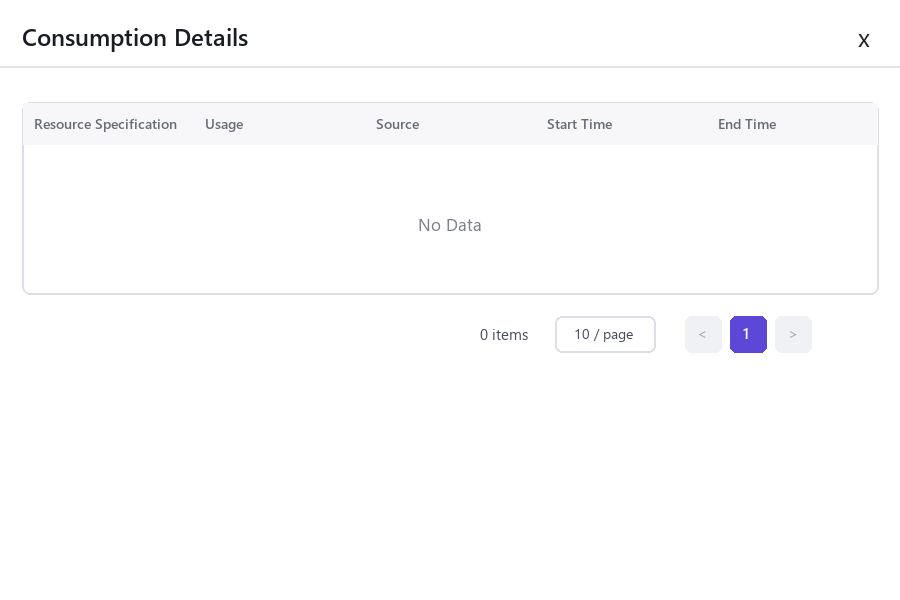
The following figure shows the page state after opening the consumption details entrypoint, which can be used to view specification usage sources.
Parameter Quick Reference
| Field Name | Required | Field Type | Example | Description |
|---|---|---|---|---|
| Time Range | Yes | Date range | Last 7 days | Limits the usage query window. |
| Resource Type | Conditionally required | Enum | GPU | Views usage by compute, storage, or instance category. |
| Resource Name | No | Text | train-job-001 | Locates the specific resource that generated usage. |
| Accumulated Usage | System-generated | Number / duration | 48 card-hours | Resource usage within the selected range. |
| Consumed Credits | System-generated | Number | 1440 Credits | Consumed credits converted according to platform rules. |
| Statistics Update Time | System-generated | Date time | 2026-07-06 10:00 | Determines whether usage data has completed synchronization. |
Pitfalls
- If details are empty, this specification may currently have no consumption records.
- Statistical data may be delayed and is not suitable as a replacement for real-time instance status.
Configuration Rules and Impact
- Resource usage is used for statistics and reconciliation and does not directly create or release resources.
- Unlimited means there is no fixed upper limit, but underlying resources and scheduling conditions still apply.
- Consumption details may be delayed. Judge real-time status together with instance details.
Result Validation
| Check Item | Success Signal | If Abnormal |
|---|---|---|
| Page entry | Usage opens with filters or statistics | Check menu permission, current business identity, and tenant scope |
| Data scope | Lists or statistics match the selected time, region, and object | Reset filters and verify time boundaries, time zone, and aggregation scope |
| Data update | Update time or latest record matches the expected cycle | Check whether the source job, metering, or quota record has been generated |
| Cross-check | Configuration, status, and relationships on Usage matches its details, billing, or monitoring records | Compare the responsible detail page by object identifier and time range |
FAQ
No Records on Usage
Symptom:
The page opens, but lists or statistics are empty.
Possible Causes:
- Filters are too narrow.
- source records are not generated.
- the role cannot see them.
Solution:
- Reset filters
- verify the source job or metering cycle
- check business identity and tenant scope.
Usage Shows the Wrong Scope
Symptom:
Data does not belong to the expected time, region, or object.
Possible Causes:
- Time boundaries differ.
- the region filter did not apply.
- ownership changed.
Solution:
- Select time and region again
- verify object identifiers
- confirm ownership in source details.
Usage Is Delayed
Symptom:
A source operation completed, but its record is not visible.
Possible Causes:
- Aggregation is not complete.
- the page is cached.
- source state is still processing.
Solution:
- Verify source state
- wait one aggregation cycle and refresh
- inspect the processing task if delay persists.
Details or Download Is Unavailable
Symptom:
The details, expand, or download entry is disabled.
Possible Causes:
- The record does not support it.
- role permission is insufficient.
- the file is not generated.
Solution:
- Select an eligible record
- check role permission
- confirm the statistics or export task is complete.
Summary and Details Do Not Match
Symptom:
The summary differs from the total of individual records.
Possible Causes:
- Periods differ.
- values are rounded.
- some records are still processing.
Solution:
- Align period and time zone
- compare by object
- wait for pending records and check again.
Notes
- Usage statistics may lag behind resource status changes. Short-term differences are common.
- Usage data may contain business resource names. Sanitize it before external communication.
- Fee or Credits explanations should follow platform metering rules. Do not use a single screenshot as final settlement basis.
Next Steps
- When usage grows abnormally, locate high-consumption instances and jobs by resource name or time range.
- When usage is inconsistent with credit changes, wait for metering synchronization and check again. Contact the operator if necessary.
- For cost review, export or record usage trends, resource types, and business purposes.
- Set shutdown or cleanup plans for long-running resources to avoid continuous credit consumption.